This post is the second in a series of five performance improvements I made to the Centered app. See 81 <iframe> Embeds for more context.
- 81 <iframe> Embeds
- 👉 Hidden Embedded Images
- Barrel Exports
- Unused Code Bloat
- Emoji Processing
Issue 2: Hidden Images
Most web apps today reuse a lot of code between different pages. Teams often create reusable packages containing shared components and media assets that can be imported into bundled scripts.
Those packages can be convenient for development - and even improve performance by reducing the total number of network requests. However, overloading the initial page bundle with too much code can also slow the page down.
I had a hunch when looking at the Centered app that it was including an excessive amount of code in client bundles. Even its relatively simple marketing pages seemed to be taking a long time to load.
Time to investigate: was Centered including excess code, and if so, where was it coming from?
1. Identification
The first tool used in many performance investigations is a Chrome dev tools > Lighthouse performance audit. I’d skipped it in the previous investigation, so I ran it now to get an overview of a page’s performance issues. The result showed the page in the “red”, meaning it indeed was slow to load:
In addition to overviews of key metrics, Lighthouse performance reports also include audits of likely ways to improve. The audits relevant to LCP in particular caught my eye:
I expanded the diagnostic to see the files breakdown.
The page’s ...pages/_app-<hash>.js file was by far the biggest of the local scripts:
For reference, the average size of an entire webpage in 2022 was under 2.3KB1. That one page bundle alone was three times the size!
What was causing the bundle to be so huge?
2. Investigation
Centered’s app is built on Next.js and uses Webpack to bundle code. One advantage of using popular frameworks such as Next.js and Webpack is that great tooling is often available for common development tasks such as performance investigations.
The Next.js docs include a handy Production Checklist guide with a Reducing JavaScript Size section. The Webpack Bundle Analyzer linked on that page is particularly useful for visualizing what goes into your bundles.
I ran the bundle analyzer on Centered, then opened the client bundle analysis to see an absurdly large GCalFeaturesIllustration chunk:
Clearly, GCalFeaturesIllustration.js was an incredibly large file.
It needed to be either shrunk in size or removed from the initial page load.
3. Implementation
I ran a fuzzy file name search in VS Code on GCalFeaturesIllustration.
It found a single source file named GCalFeaturesIllustration.tsx.
That file was exporting a GCalFeaturesIllustration React component containing a single <svg> element spanning over six million characters of code.
Nearly all of those characters came from xlinkHref embeds inside <image> tags.
<image
	id="image0_5_758"
	width="1740"
	height="1161"
	xlinkHref="data:image/png;base64, ...(thousands or millions of encoded image characters)..."
/>
It seems we’d found our culprit.
Millions of bits of data coming from those <image> tags was bloating the initial page bundle with unnecessary code.
I had to wonder: where was the component being used? Depending on that usage, perhaps there’d be a way to shrink down the embedded images to a much smaller size?
I searched for all references to the GCalFeaturesIllustration component and found that it was used only in a GCalSuggestionModal component.
That GCalSuggestionModal component was exported from the index.ts of a shared components package, but never used anywhere else!
I deleted the GCalSuggestionModal and GCalFeaturesIllustration components locally, re-ran a production build, and opened it locally.
The app worked flawlessly.
4. Confirmation
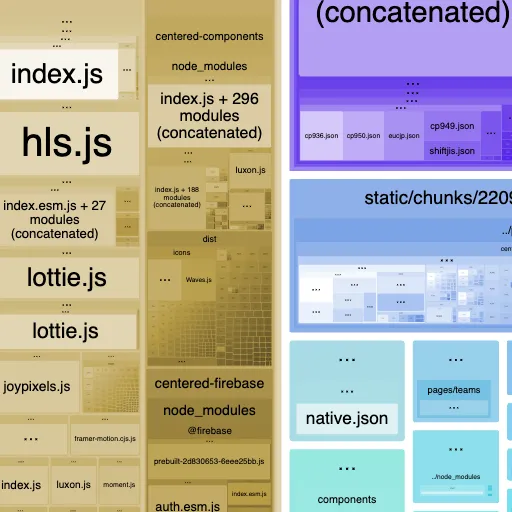
I checked the updated view of the analyzed webpack bundle to confirm the GCalFeaturesIllustration component was no longer present:
I next ran a Lighthouse performance audit on the updated app build. A few metrics did improve - though not as much as I’d hoped:
Looks like while removing the one giant component did help, there were still many other large files to be removed. Work for another day.
In Conclusion
Giant inline assets can easily slip into your asset bundles if you’re not looking for them. Tools like Webpack Bundle Analyzer can visualize where space is taken up in your bundles, allowing you to scan for exceptionally large files.
As always, verify your performance hunches with tooling such as a Chrome dev tools > Lighthouse performance audit. You never know how far any improvement will take the page!
Up Next
Deleting the largest offending file wasn’t enough to fully save Centered’s lighthouse performance score. And why was an unused file even being loaded on the client in the first place?!
Speeding Up Centered Part 3: Barrel Exports shows off how we removed plenty more unnecessary files to get that performance score out of the red. It produced much more encouraging performance improvements - would recommend reading on!
- 81 <iframe> Embeds
- 👉 Hidden Embedded Images
- Barrel Exports
- Unused Code Bloat
- Emoji Processing
Footnotes
Liked this post? Thanks! Let the world know: